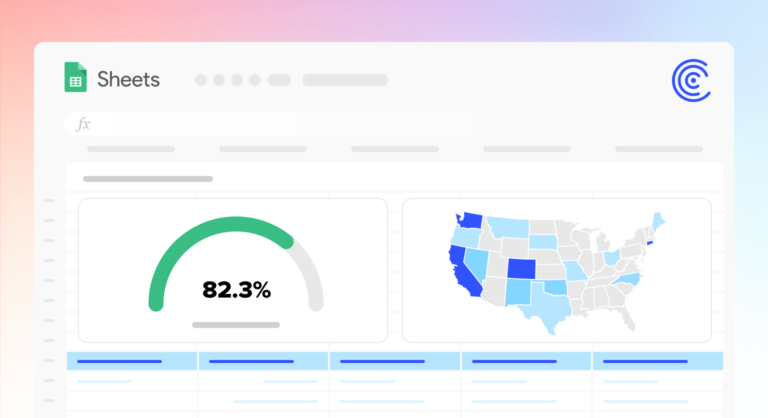
Data aggregation is collecting and presenting data in a summarized manner for statistical analysis and to effectively fulfill business objectives. Data aggregation is important to store data as it helps make decisions based on a huge amount of raw data. In addition, data aggregation enables the user to forecast trends and help with predictive modeling. Effective data aggregation also helps in minimizing performance issues.The aggregation offers more information related to data clusters like an individual’s profession or income. For example, a store that wants to analyze the sales performance of different regions can easily aggregate the sales data based on specified regions.Queries with aggregation give faster results. For instance, the query
Read more · 3 min readDo you need help with data analysis and using pivot tables in Spreadsheets?You have landed in the right place!Google Spreadsheets has proven to be very beneficial in arranging data, but when you have a big volume of data, Google Sheets gets difficult to handle. But this is where Google sheets pivot charts and tables come in as a savior.In this guide, you’ll get an overview of how pivot tables in Google sheets are beneficial for making data arrangement effective and easier.So, let’s get started!What are Pivot Tables?A Google Spreadsheet is a set of rows and columns. Adding formulas to it
Read more · 3 min read


